
Episode 35
Property market stats
July 29th, 2020
25 mins 41 secs
Your Hosts
About this Episode
Stuart and Simon talk stats. Comparing the property market in 2020, with all it's ups and downs, to the much more steady 2019.
Included in this weeks discussion (and see below for the graphs):
- Three interesting graphs based on data collected by PaTMa's price history browser extension.
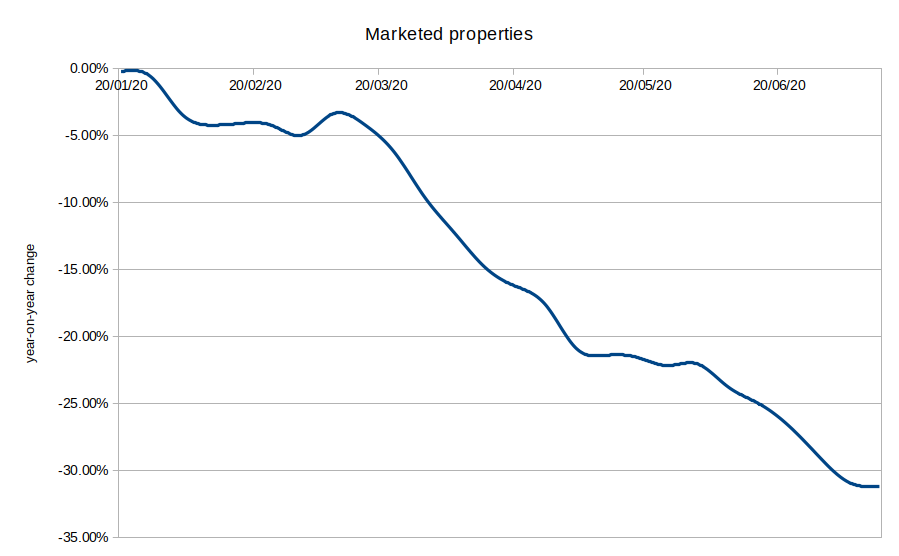
- 30% fewer properties currently on the market.
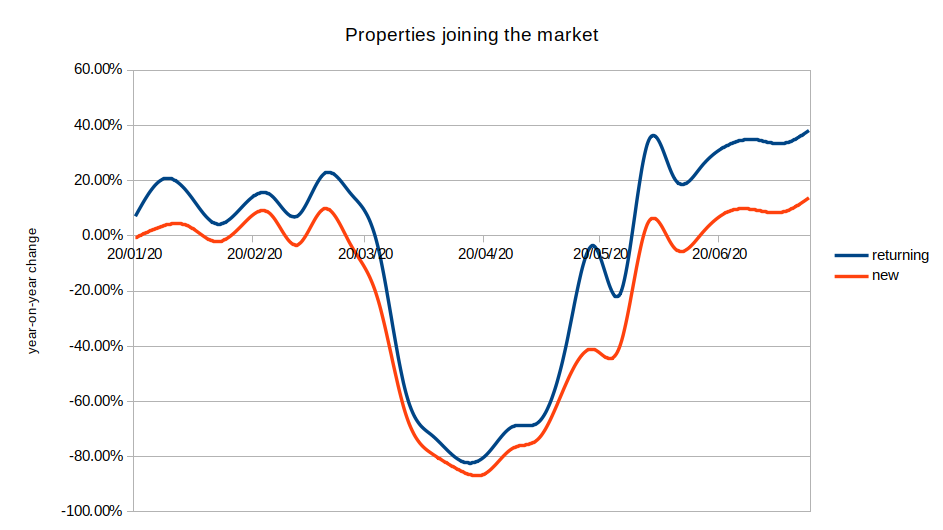
- Three key phases of 2020 are clearly visible:
- "Boris bounce"
- Covid19 era
- Lockdown easing
- 90% fewer properties being brought onto the market.
- Can school holidays be seen in the data.
- The total number of properties compared to 2019 has still been falling.
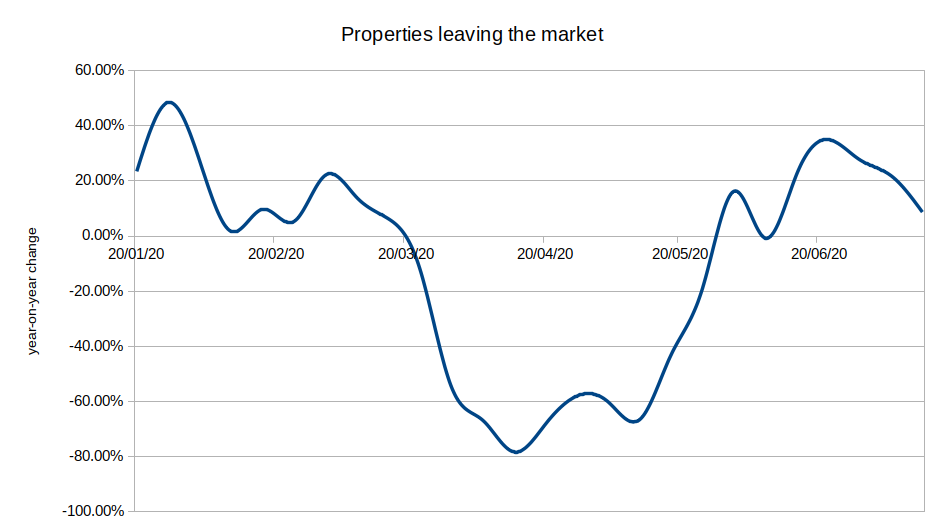
- Nearly 50% more properties leaving the market in January 2020.
- Nearly 40% higher (than 2019) leaving rate as lockdown eases.
- Are all properties "on the market" really available.
Graphs being discussed:
If you can't see the graph images above, you can click these links to view each graph:
- Marketed properties year-on-year change 2020
- Properties joining the market, year-on-year change 2020
- Properties leaving the market, year-on-year change 2020
Please leave us a rating and review if you're enjoying the show.