Episode 50
Property listing and pricing stats
November 11th, 2020
26 mins 24 secs
About this Episode
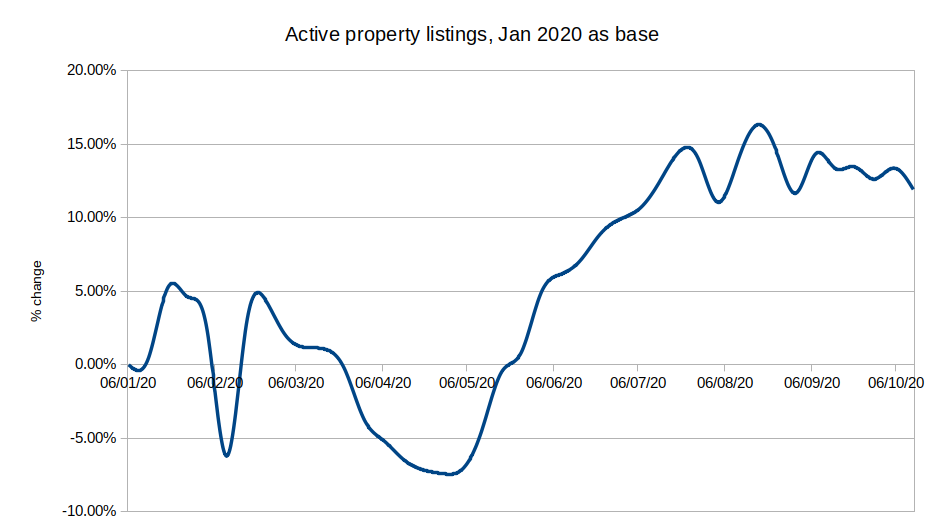
Simon and Stuart chat through a couple of graphs showing how the property market has behaved so far this year.
The discussion this week included:
- Stats collected thanks to the PaTMa property browser extension.
- You might be able to see the graphs included below, if not use these links: graph 1 and graph 2.
- Christmas is coming!
- Was the post-lockdown (v1) market hype, overhyped.
- Sellers and agents building stamp duty savings into their price.
- Our previous market stats podcast.
- Our conversation with Tom.
- Occasional down-valuations causing mortgage (and re-mortgage) issues for some.
- What's coming next for (changes in) property prices.
The graphs being discussed:


If you can't see the graph images above, you can click these links to view each graph:
If you've enjoyed this podcast, please tell someone else about it.
